Meta claims that its shift toward a “Community Notes” model is working, judging by the latest Community Standards Enforcement Report update, which provides data on the company’s efforts to moderate content and combat harmful activity across its apps.
As you’ll no doubt recall, in January Meta announced it was moving to a Community Notes-style model, following X’s example, while also ending its third-party fact-checking program. According to Meta CEO Mark Zuckerberg, the idea was that Meta had reached a point where censorship had gone too far, so the company wanted to give users more power to make their own decisions on content, instead of imposing top-down rulings.
The fact that this approach aligns with the preferences of U.S. President Donald Trump is pure coincidence and in no way connected to Meta’s stance on the issue.
So how does Meta evaluate the success of its Community Notes initiative in the U.S.?
According to Meta:
“Out of hundreds of billions of pieces of content created on Facebook and Instagram in Q3 worldwide, less than 1% violated our rules and was removed, and less than 0.1% was removed incorrectly. For content that was removed, the accuracy of our enforcement decisions – that is, the share of correct removals out of all removals – was over 90% on Facebook and over 87% on Instagram.”
Meta says the number of mistakes is down, and therefore fewer people are complaining about their posts being wrongly removed by Meta’s automated system.
From Meta’s perspective, that’s a win, but at the same time, if you’re removing far less content overall, then of course there will be fewer errors.
That also shows up in the data. For example, the report’s “Bullying and Harassment” section notes that over the past three quarters there’s been a significant drop in the share of violations proactively detected by Meta’s systems compared to those reported by users.
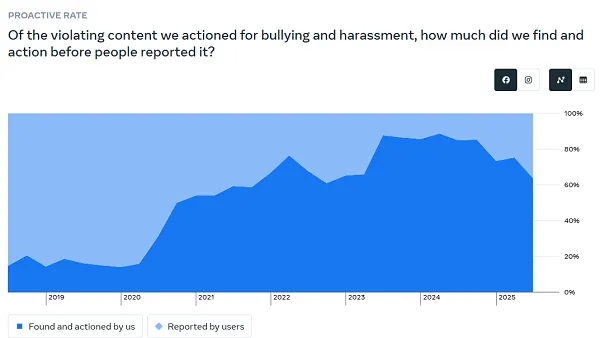
📈 Proactive detection of bullying and harassment
The chart shows what share of violating content (bullying and harassment) the platform found and took action on by itself, before users had a chance to report it.
- The horizontal axis covers years from 2019 to 2025.
- The vertical axis shows the percentage of violations where action was taken proactively.
🔵 The dark area – “Found and actioned by us”: content the system and moderators found on their own.
🔵 The lighter top area – “Reported by users”: content that was only found after user reports.
📊 Dynamics:
- In 2019, the proactive level was low (roughly 20–30%).
- From 2020–2021, it rises sharply and exceeds around 60–70%.
- In 2023–2024, it peaks (almost up to 90%) – the platform is intercepting most bullying content on its own.
- In 2025, the figure drops slightly, but still remains high – around 70+%.
💡 The takeaway: over time the platform has gotten much better at automatically detecting bullying and harassment, and relies less on user reports.
Proactive detection and enforcement by Meta in this area has dropped by 20%, which means more users are being exposed to content that violates the rules.
The same pattern shows up in the “Hateful Conduct” chart:
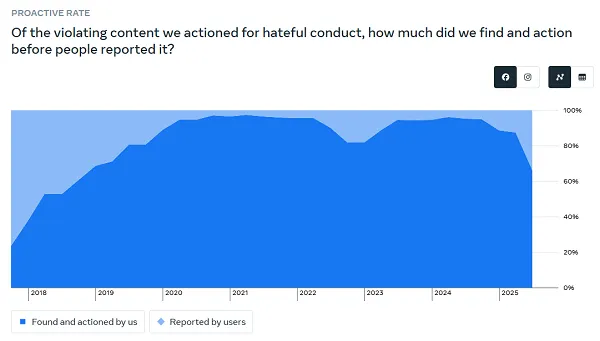
📈 Proactive detection of hateful conduct content
The chart shows what share of violating content related to hateful conduct the platform finds and removes on its own, before user complaints.
- On the X axis – years from 2018 to 2025.
- On the Y axis – the share of violations where action was taken proactively (percent).
🔵 Dark area – Found and actioned by us
Hateful content found by algorithms and moderation without user complaints.
🔵 Light top band – Reported by users
Violations detected only after user reports.
📊 What the trend shows:
- In 2018, the proactive level was noticeably lower (around half of all cases).
- By 2019–2021, the platform sharply improved automatic detection: the proactive rate rises to 90–95%.
- In 2022, there is a slight dip, but the level remains very high.
- In 2023–2024, it again stays close to its maximum.
- In 2025, the share of proactively detected content decreases, but still sits around 80+%.
💡 The point: in recent years the platform has learned to catch almost all hateful content on its own, before user reports, though in 2025 this metric dipped slightly compared to its peak.
The latest drop on the chart indicates a significant reduction in proactive efforts in a problem area that has long been known to spread rapidly via social platforms.
So while Meta may indeed be making fewer mistakes by over-enforcing rules and punishing users unfairly, which aligns with the more “hands-off” approach Zuckerberg and his team are aiming for, the end result is that more people are being exposed to potentially harmful content in Meta’s apps. Judging by the declines shown in these charts, Meta’s systems could have detected and removed more of this content, but the company is choosing to let more through and framing that as a positive, because users are less heavily restricted.
Essentially, although Meta claims a “precision rate” of 90%, it’s hard to quantify the success of Community Notes as an alternative to systematic moderation if the only metric is whether users complain or not. For creators still betting on thoughtful text in the feed and looking to strengthen each post with a meaningful caption, the detailed guide How to caption a photo on Instagram? comes in handy.
When it comes to specific policy areas, Meta says the following:
“On both Facebook and Instagram, the prevalence of adult nudity and sexual activity, and violent and graphic content increased, and on Facebook the prevalence of bullying and harassment increased as well. This is largely due to changes we made during the quarter to improve reviewer training and refine review workflows, which affect how samples are labeled when measuring prevalence.”
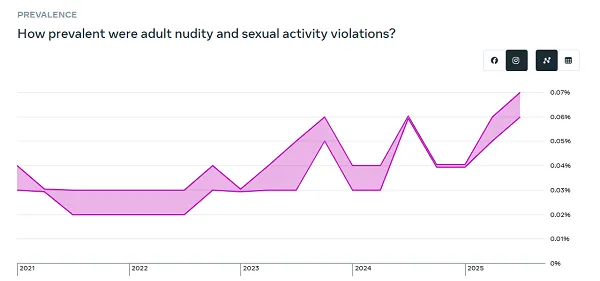
📈 How often the rules on nudity and sexual activity are broken
The chart shows the share of violations related to adult nudity and sexual content from 2021–2025.
- In 2021, the violation level starts higher, then falls slightly and stays relatively low.
- In 2022, the figure remains about the same, near the bottom of the chart.
- In 2023, growth starts: by mid-period the curve rises noticeably, then briefly drops, then climbs again.
- In 2024, there’s another spike upward, then a partial decline and stabilization.
- In 2025, the line rises again and by the end hits its highest value across all years (just under 0.07% of all viewed content).
💡 Conclusion: the share of content violating rules on adult nudity and sexual activity remains very low as a percentage of all content, but since 2023 there’s a clear upward trend, with a peak in 2025.
Given that explanation, it’s hard to say whether this is actually significant, since Meta claims the increase is purely methodological.
These spikes may well deserve attention, and they may indeed be signs of improvement.
However, in light of recent efforts to tighten restrictions on social media for teens, this chart is still concerning:
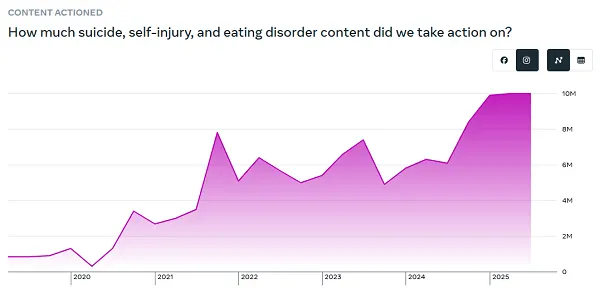
📈 How much suicide, self-harm and eating disorder content the platform removes
The chart shows how many pieces of content about suicide, self-harm and eating disorders the platform has taken action on (removal, restriction, warnings) from 2020 to 2025.
- In 2020, volumes are relatively small, the line is low.
- At the end of 2020 and early 2021, you see the first noticeable jump upward.
- In 2021–2022, the amount of such content receiving enforcement grows sharply and reaches an initial peak.
- In 2023–2024, the numbers remain high, with waves of rises and falls, but clearly well above 2020 levels.
- In 2025, the curve rises sharply again and reaches around 10 million cases – the highest value across the entire period.
💡 Important: the chart does not show “how much such content exists in total”, but how many pieces the platform actually acted on. Growth may reflect stronger moderation, more such content being posted, or both. For creators and social media managers, an additional indicator of audience health remains saves and engagement under safe content – this is easier to track using techniques from How to see who saved your photo on Instagram.
As for fake accounts, Meta says around 4% of its more than 3 billion monthly active users are fake.
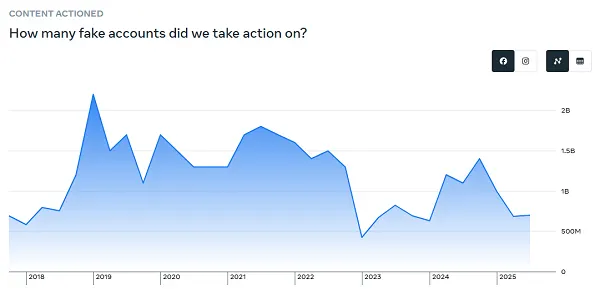
📈 How many fake accounts the platform blocks
The chart shows how many fake accounts the platform has taken action on from 2018 to 2025 (deletion, disabling etc.).
- In 2018, the level is relatively low, but a sharp rise begins by the end of the year.
- In 2019, the curve jumps to nearly 2 billion accounts – the highest peak in the entire period.
- In 2020–2021, the figure stays high but gradually declines, though it’s still in the billions.
- At the end of 2022, there is a steep drop almost to minimal values.
- In 2023–2024, there is a wave-like rise again: first a climb, then a dip and then another strong peak.
- In 2025, the number of blocked fakes declines and stabilizes at around 1 billion accounts.
💡 Conclusion: the platform removes enormous volumes of fake accounts every year, with the toughest enforcement in 2019. Since then there’s been a general downward trend, but the numbers are still huge.
Many people question these figures based on their own experience dealing with fake profiles on Facebook and Instagram. These days it’s hard to tell a fake profile from an AI-driven one – and should they be treated as the same thing? Meta, for instance, is working on a project to add AI personas into its apps that will interact like real people. Are those “fakes”?
In any case, for comparison, 4% of the total 3.54 billion users still amounts to more than 140 million fake profiles in Meta’s apps, which the company openly acknowledges.
There you go.
Meta has also released an updated version of its “Widely Viewed Content Report”, which provides more detail on what people actually see on Facebook in the U.S.
The report was first published in 2021 to counter the idea that Facebook’s algorithms primarily boost divisive and misleading content. By showing which post types and pages get the most impressions, Meta is trying to emphasize that the problem is not as big as it may seem – though again, at Meta’s scale, even content with relatively modest engagement can still reach millions of people. When analyzing reactions across the Meta ecosystem, it makes sense to look not only at reach but also at who is interacting with your content, which is broken down in detail in How to see who liked your post on Instagram.
When it comes to what gets the widest reach, Meta says the most engaging content on Facebook is primarily mainstream news.
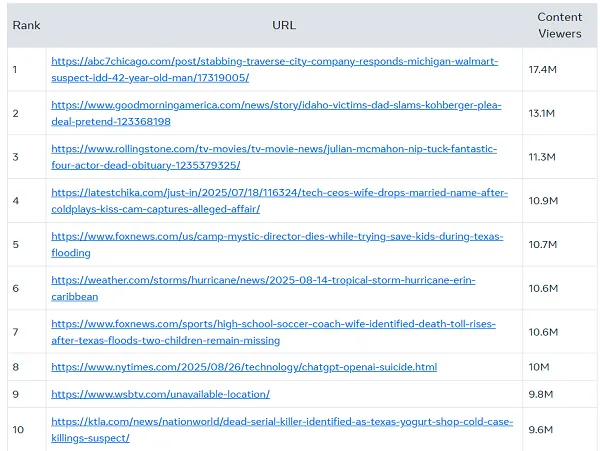
Crime stories, the death of actor Julian McMahon, a couple at a Coldplay concert – these are the kinds of news items that got the most attention on Facebook in Q3.
So these are not highly political, divisive posts, but intriguing stories about real-world events. That is better than the usual content that tends to fill this list (tabloid gossip usually wins), but Facebook’s main point here is that political content is not the dominant topic of conversation in the app.
However, overall it is worth noting that the share of attention going to the most popular posts is tiny within the scale of Facebook as a whole.
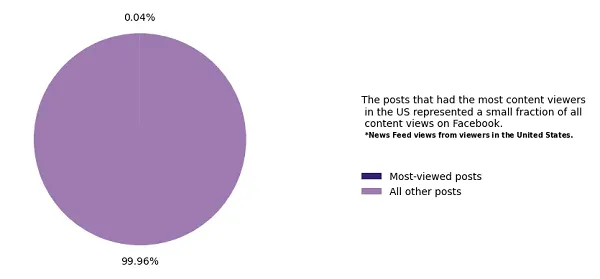
📊 Super-viral posts on Facebook are a micro-drop in an ocean of content
The pie chart shows what share of all News Feed views in the U.S. is taken up by the very “most viewed” posts.
- 🔹 Most viewed posts – only 0.04%
- 🔸 All other posts – a massive 99.96%
✨ Conclusion: even the posts that attracted the most viewers in the U.S. account for just a tiny fraction of all content views on Facebook. Most attention is spread across millions of regular posts.
In the broader context, the platform’s scale and reach are so huge that any amplification matters, so even with these notes about the top posts we still do not get a full picture of Facebook’s overall influence.
And then there’s this chart that digital marketers hate:
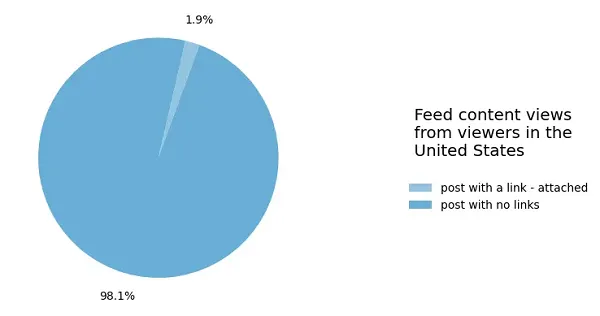
📊 What types of posts get most views in the Facebook feed (U.S.)
The chart shows which posts get feed views from U.S. users:
- 🔹 Posts without links – a full 98.1% of all views.
- 🔗 Posts with attached links – only 1.9% of views.
✨ Conclusion: almost all feed consumption is driven by regular posts without external links. “No-click-out” content clearly dominates.
Link posts make up a tiny share of all Facebook content, so if you are hoping to drive traffic, you are likely in for disappointment. For those who still build some traffic around visual content and prefer to post not only from a phone but also from a work laptop, the step-by-step guide How to make a new Instagram post from a computer helps.
The share of posts with links has declined compared to Q1, when it was 2.7%, whereas in 2022 it was 9.8%.
So there has been a significant drop in the number of link posts in the app.
Overall, there is nothing particularly groundbreaking in Meta’s latest transparency reports. Moderation improvements are reducing the number of errors, but potentially increasing the risk of harm. Although by Meta’s own metrics there is “progress” there too. While Meta is balancing between moderation and freedom, creators often adapt their strategy to audience behavior across multiple platforms at once, and when it comes to finding ideas for content, the practical breakdown How to find popular search queries on YouTube is a big help.


